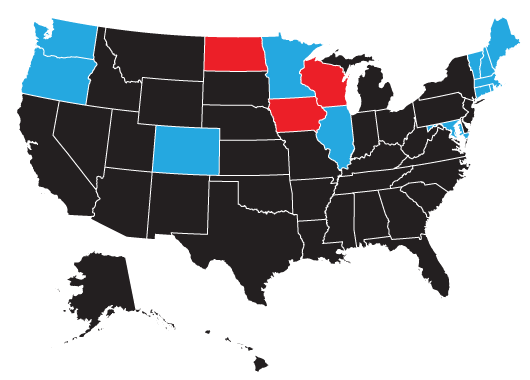
What the 2016 Presidential Electoral Map would look like if ‘Nobody’ ran opposite Hillary Clinton and Donald Trump
About 17 million more people voted in the 2020 Presidential election than in the 2016 election. In the 2020 election, just under 2 out of 5 citizens over the age of 18 did not vote, that is about 103.7 million potential voters. In 2016, over 2 out of 5 did not vote, that is about 112 million people. Combine this with the dynamics of the state-by-state U.S. electoral vote process, in which a candidate receives all the electoral votes* of one state, the question arises as to how much support does a Presidential candidate really receive during a Presidential election?
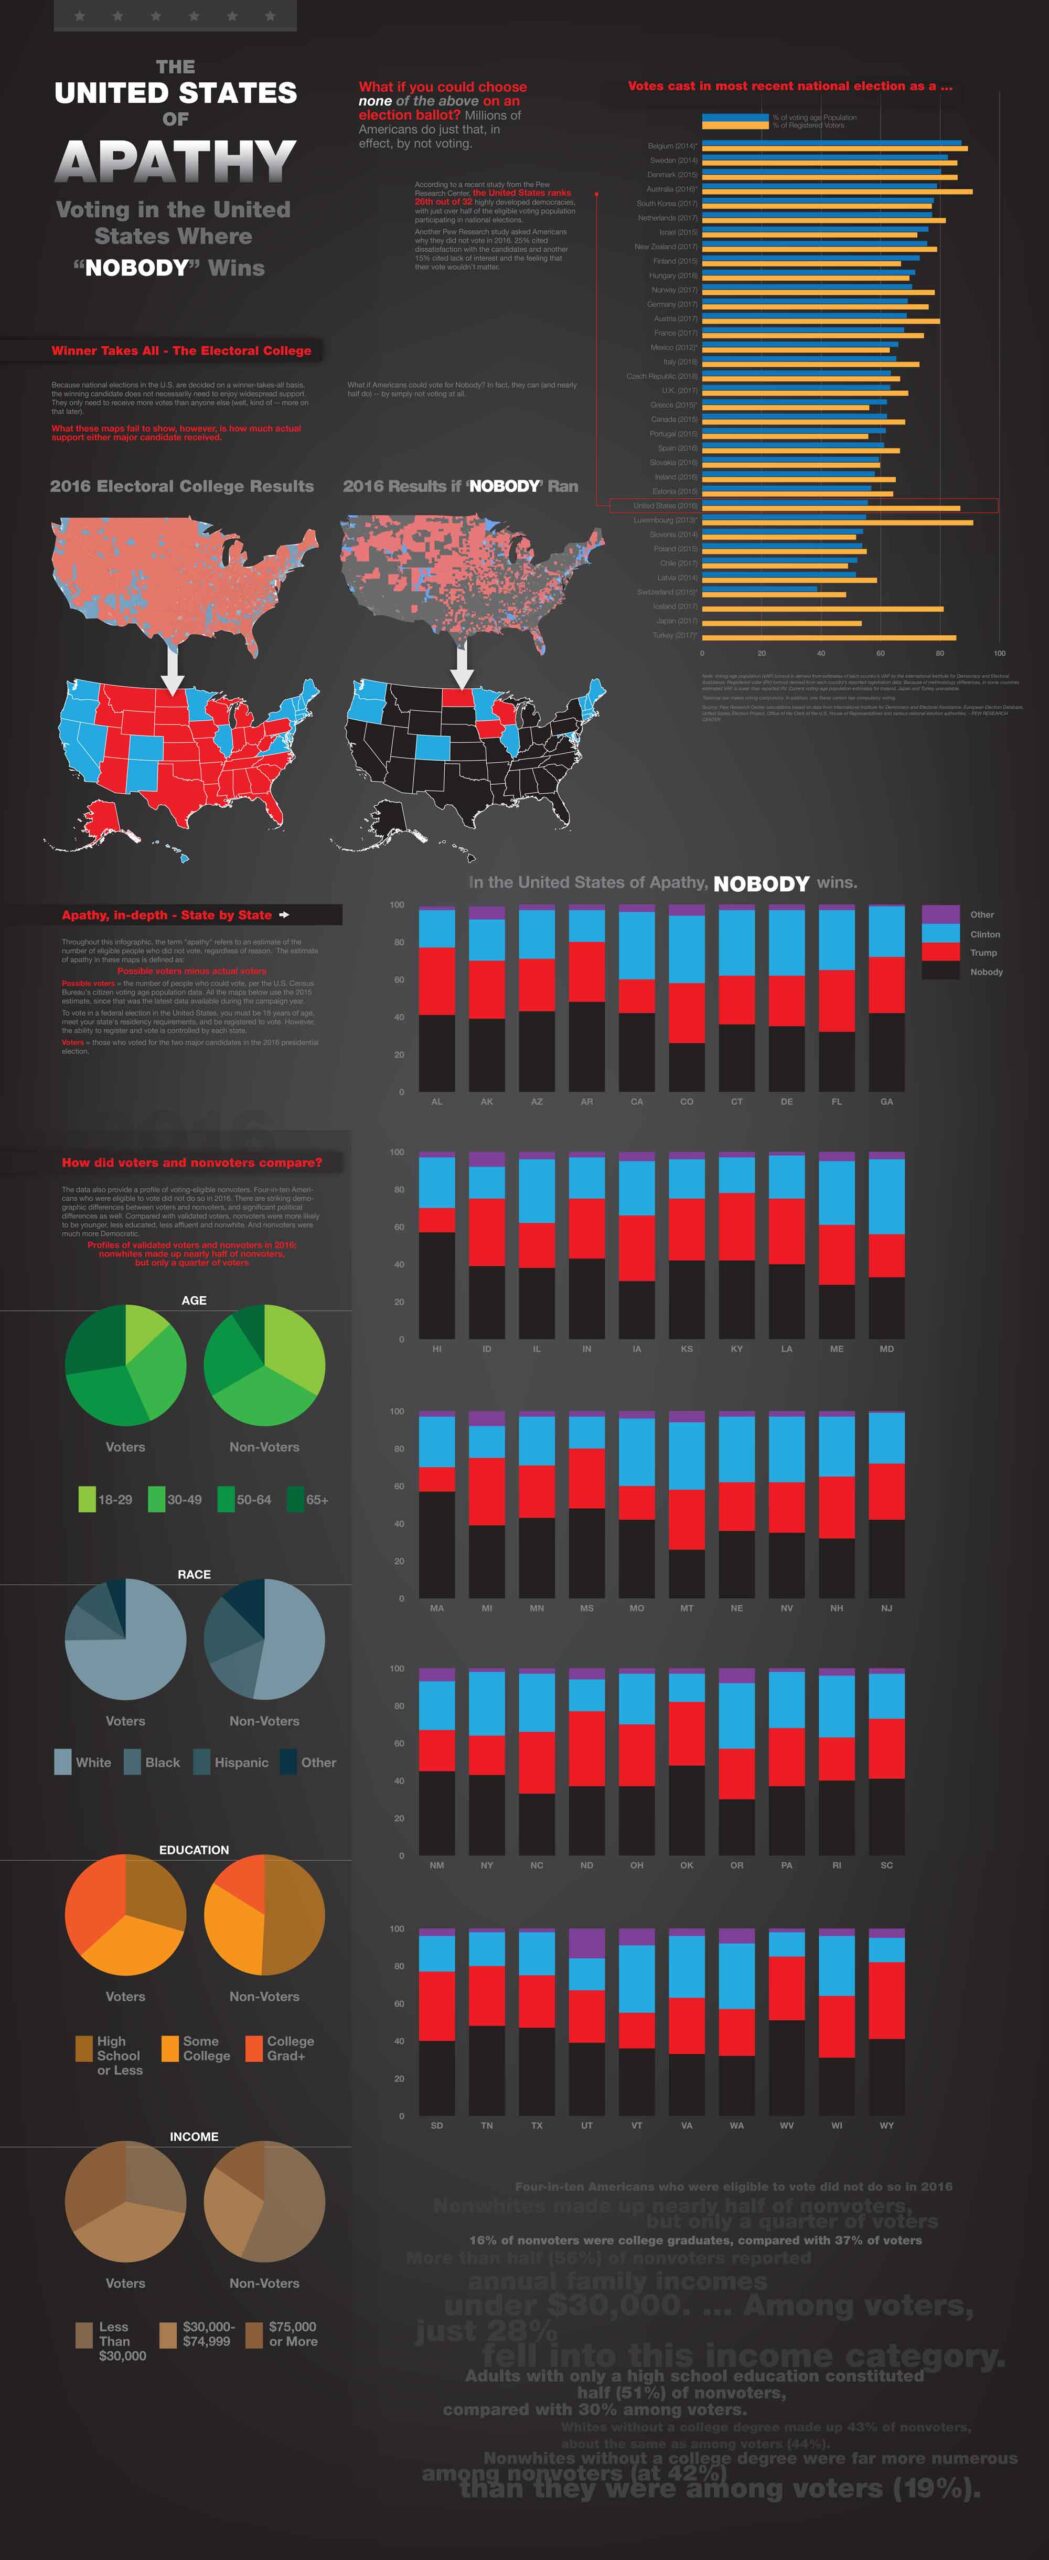
The following posters and informational graphics relay information on the amount of people who actually have participated in the electoral process of the last two Presidential elections. The U.S. maps show hypothetically what would happen if all the citizens who did not vote for a major party’s candidate or a third-party candidate would cast their vote for a candidate called, “Nobody”. The striking result is not only the fact that the candidate, Nobody, would win, but by how great that victory would be.
If one took the percentage of U.S. voting participation and held it up to international standards in 2020, we would rank 17th of 37 developed countries in the world. In 2016, we would have ranked 26th. These graphics give a general sense of voting demographics and how the electoral process would pan out with a Nobody candidate.
*Maine and Nebraska split their electoral votes
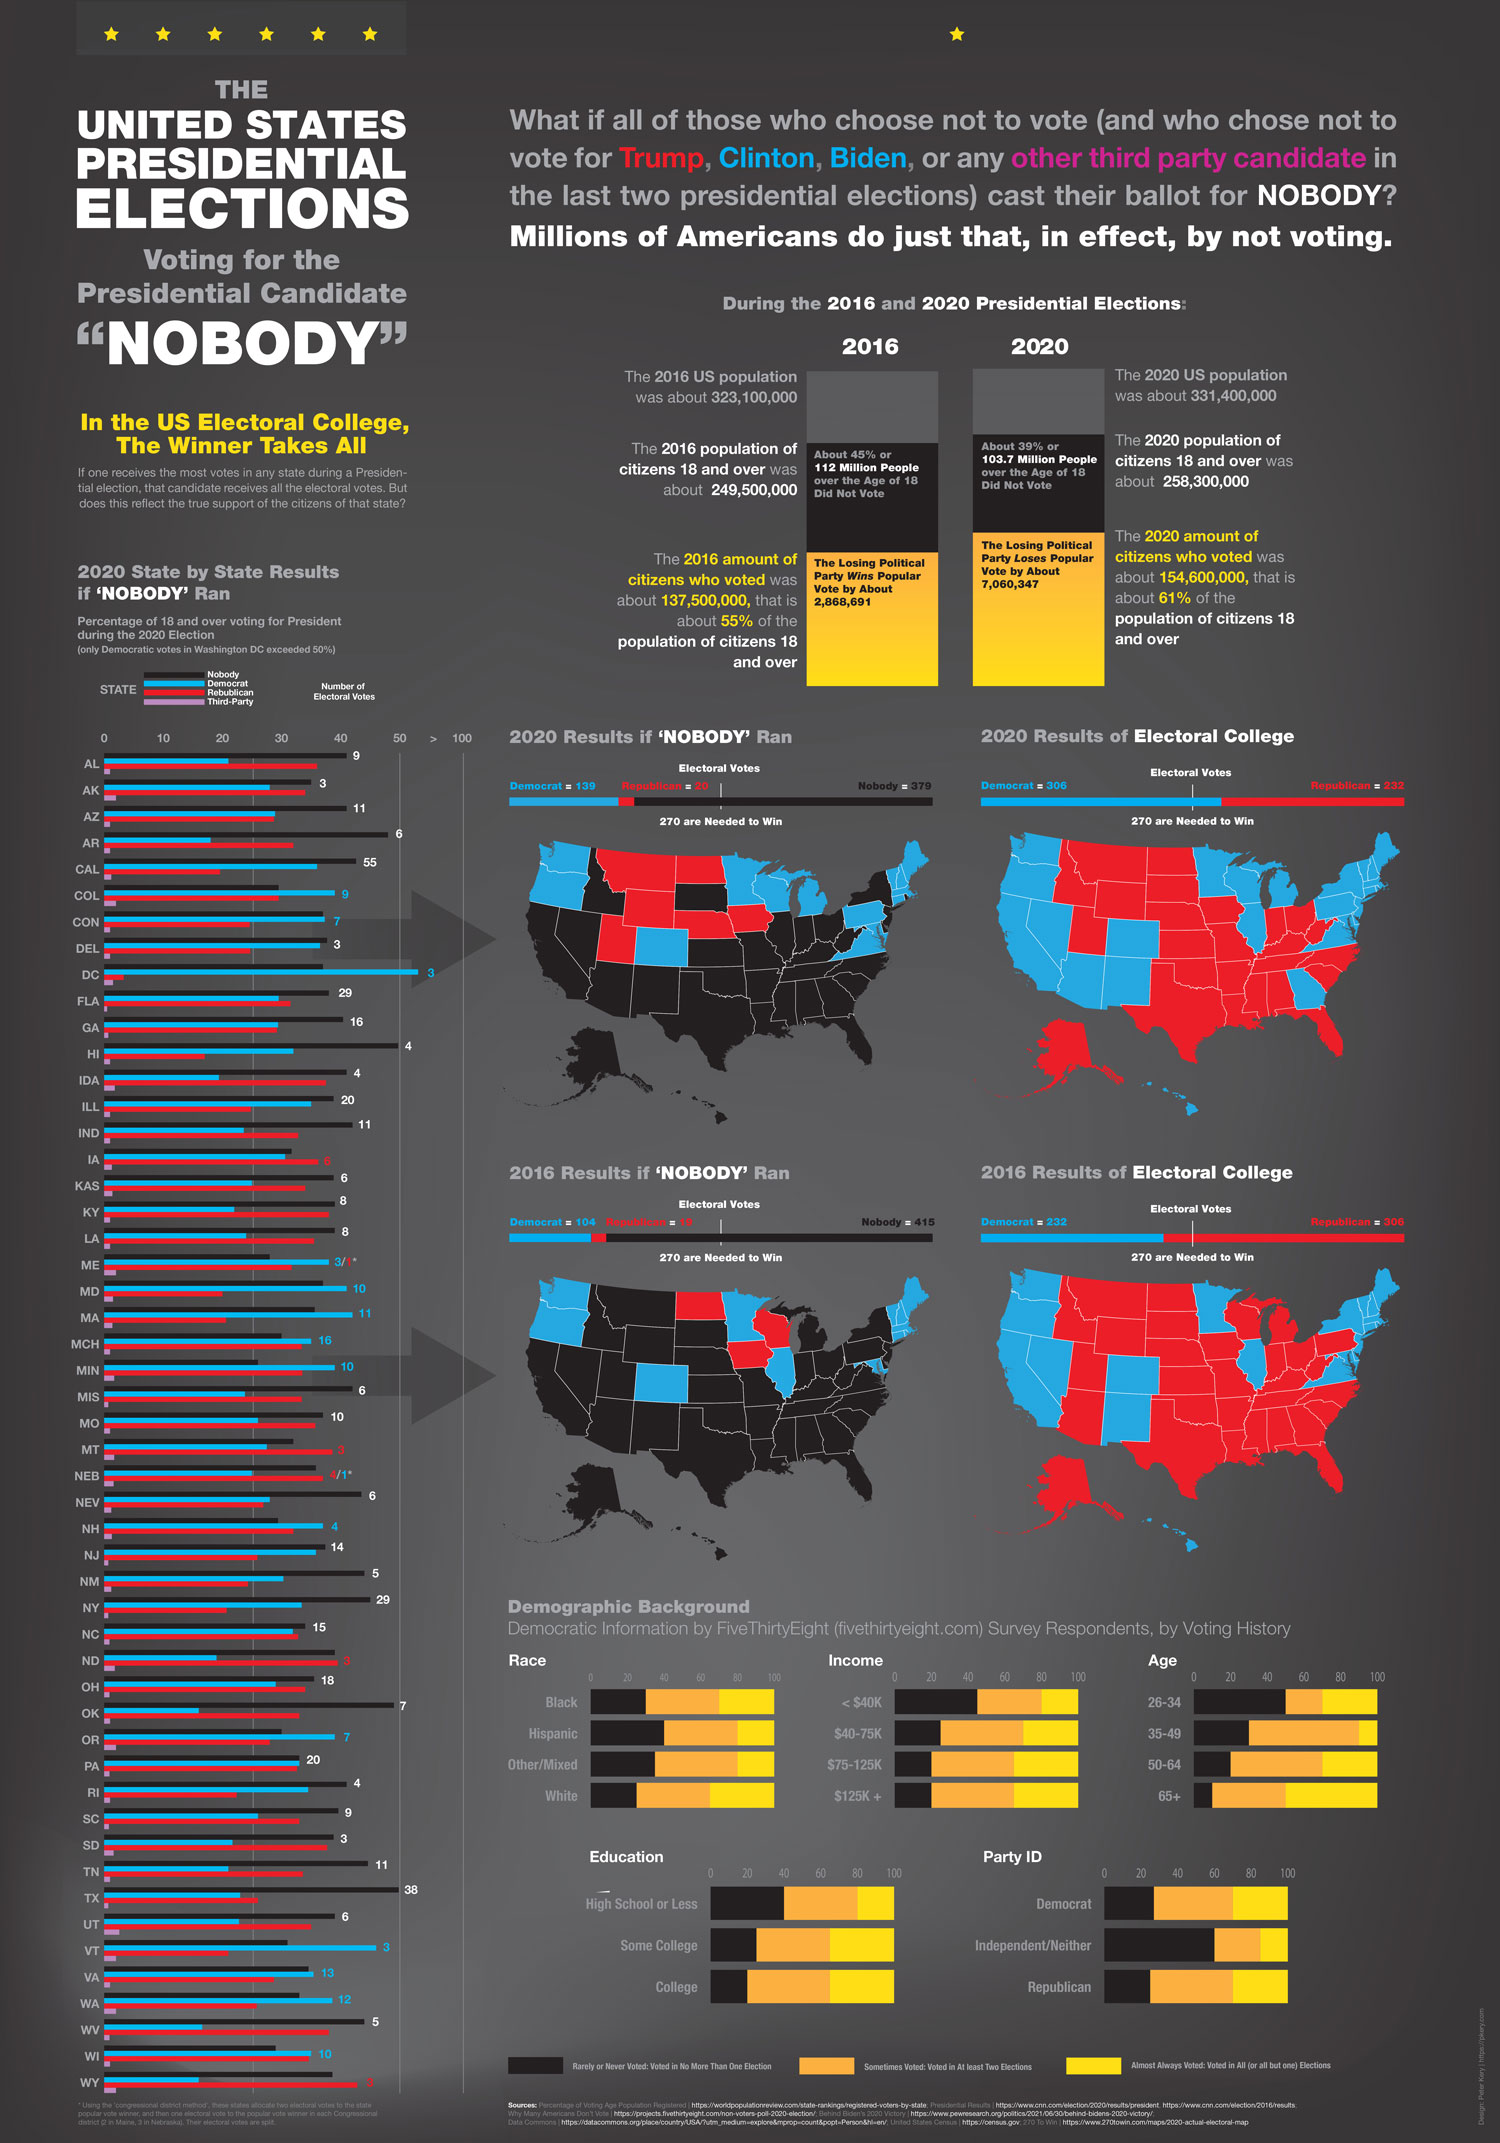
Poster and Informational Graphic. The United States Presidential Elections, Voting for the Candidate, Nobody
2016 Presidential Election