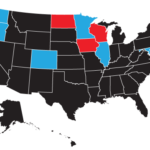
Students are given a map of the United States. They are charged with creating an informational graphic. Data and content is of their choice. Research, interpreting, critiquing, and producing infographics are great ways for student designers to learn and practice data and literacy skills. Research and discussions included: the interpretation of various infographics; reading and understanding graphs, charts, diagrams, and maps; finding patterns in data and interpreting their meaning; and arguing from evidence to support their interpretation of the infographic. Critiques involved using evidence to support the content. Students gained experience in analyzing data, finding and explaining patterns in data, and deciding how to visually present that data. Two important aspects of the assignment was to present information clearly and investigate whether one can create an emotional resonance to their result.

Brooke Lillie, University Minnesota Duluth, Fall 2021


